Data Visualization
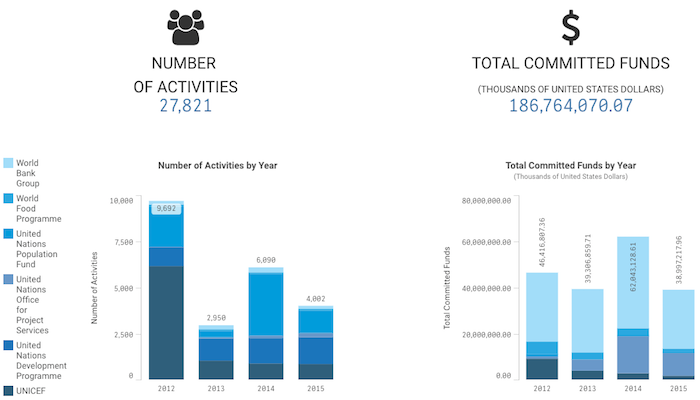
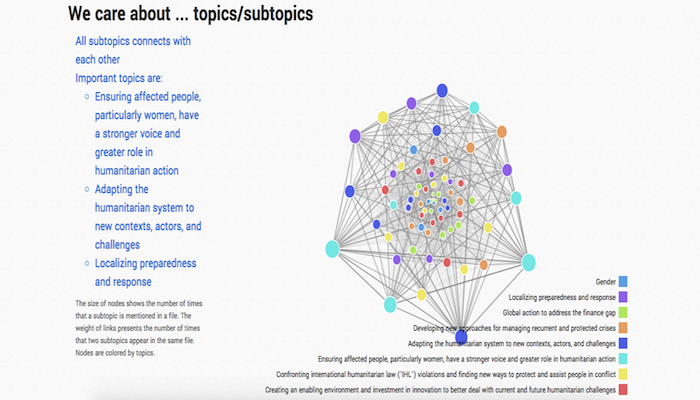
Investigation of Humanitarian Topics
Use World Humanitarian Summit(WHS) Consultation data and Twitter data to investigate topics about humanity. See also: World Humanitarian Summit
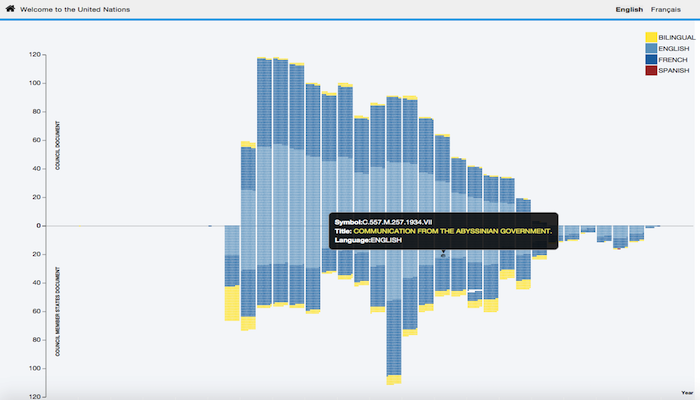
Visualization of Legal of Nations Documents
Show every Legal of Nations docs as a node in a bar chart.
* After opening the Enterprise Search, please click the 'Open Data Visualization' button to check the chart
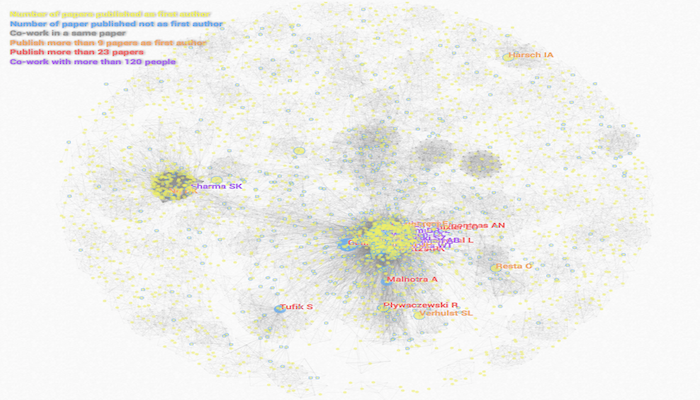
Analysis Sleep-Disordered Breathing(SDB) Research Papers about Obesity
ReportVisualize relation among researchers and investigate who did research in this field at where and when.
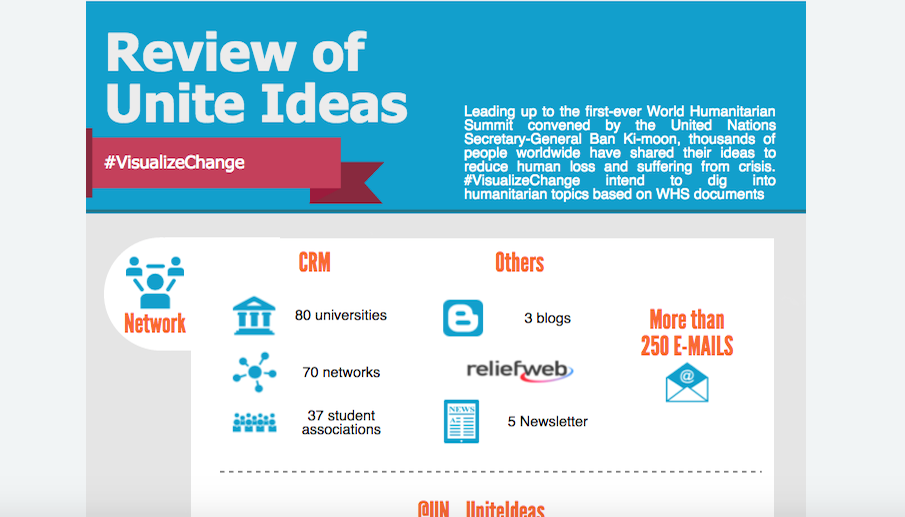
Infographic Report for Unite Ideas Challenge
#VisualizeChange #WSD2015Extract web traffic and social media data from Google Analytics and Twitter Analytics to report the effectiveness of Unite Ideas marketing
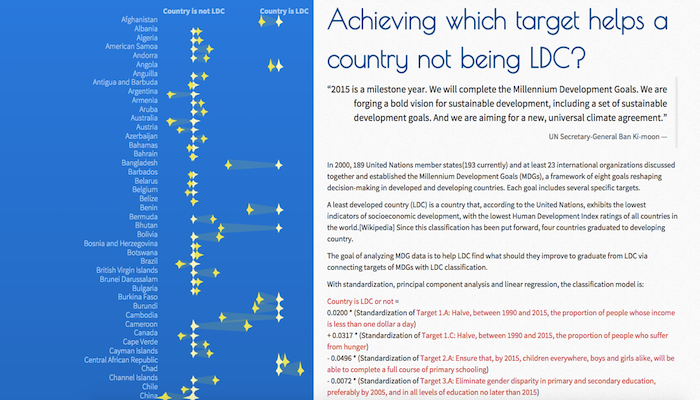
Achieving which target helps a country not being LDC?
Use Millennium Development Goals dataset to classify countries into least developed country(LDC) or not least developed country.
Data Analytics & Data Mining
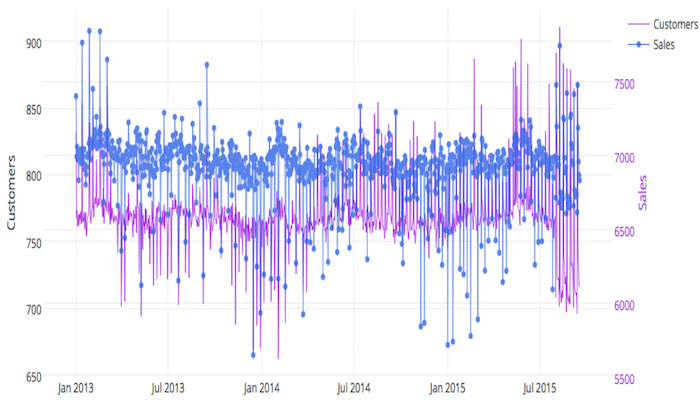
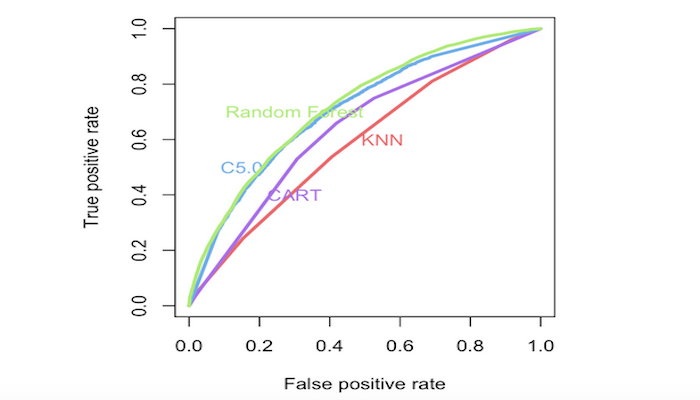
Prediction of Rossmann Store Sales
BIA 656 Statistical Learning course project
Poster
Report
I handle dataset with complex structure with Python. I use decision tree, KNN and random forest to predict sales. I also find more business insights by visualization with Plot.ly.
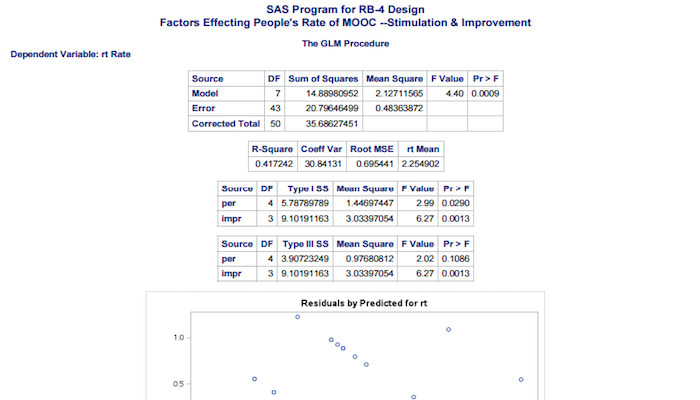
Experimental Design for Influential Factors of Rates on Massive Open Online Courses
BIA 654 Experimental Design course porject
Dataset
Report
Use ANOVA F-test, multiple comparison tests and orthogonal test for completely randomized factorial design and Randomized block factorial design do find the factors affecting people's rate on MOOC base on 51 questionnaires
Online News Popularity Classification with R
CS 513 Knowledge Discovery course porject
Output
Use R and classification models to classify Mashable articles into popular or unpopular.
Feature Ranking in Search Rank
Apply Gradient Boosted Regression Trees in Predicting Search Rank
Poster
Use machine learning to bring more free traffic to your website. I rank the most important features in search rank, explain how it works with decision tree and take Diapers.com as an example to make practical suggestions.
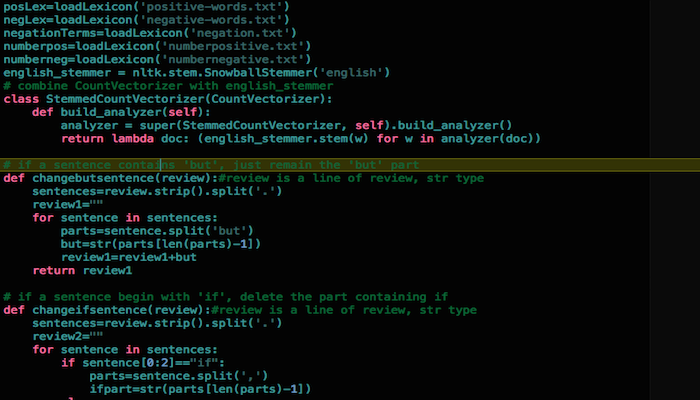
Text Mining of Restaurant Reviews on OpenTable and Yelp
BIA 660 Web Analytics course porject
Code
Use NLTK and sklearn to classify restaurant review into position and negative.
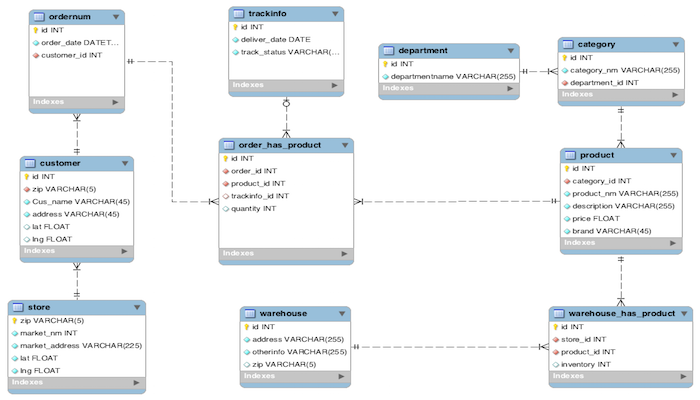
Walmart Database
MIS 630 Database course porject
Slides
Design the database of Walmart based on the website and write SQL query to achieve 10 functions.